
Re-opening the Economy: “Back to the Future”
For those who never saw the movie, “Back to the Future” is about a kid who gets sent back in time and encounters his parents when they are in high school. After several mishaps, he finds a way to make it “Back to the Future” from whence he came. Lo and behold, the life he originally left is now a bit different following the effects of his trip back in time.
In a way, it feels a little like our reality has changed from how it would have been were it not for COVID. After all, we all now know how to Zoom, live with a mask, and look up a menu using a bar code among many other things. The same is true for the economy. Industries that were in their infant stages back in 2019 are now mature and mainstream. Other industries and technologies we thought were here to stay have become relics.
So, how should investors look at the re-opening? With enthusiasm and a hint of skepticism, is our answer. The re-opening is going as well as could be expected. While not every industry is back on its feet there are many that are and some that thrived during COVID.
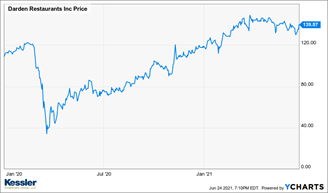
Restaurants that survived are seeing significant growth in revenue. For instance, Darden Restaurants, parent of Olive Garden, reported a 90% increase in revenue year-over-year. Not only that, but they also generated more revenue than they did in 2019 BEFORE the pandemic. Furthermore, they accomplished this with fewer tables available due to social distancing.
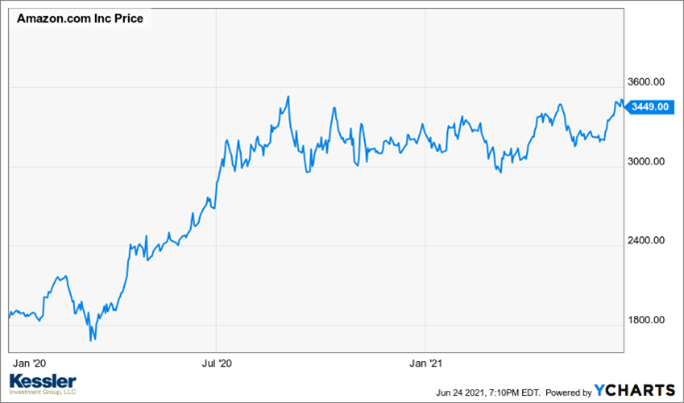
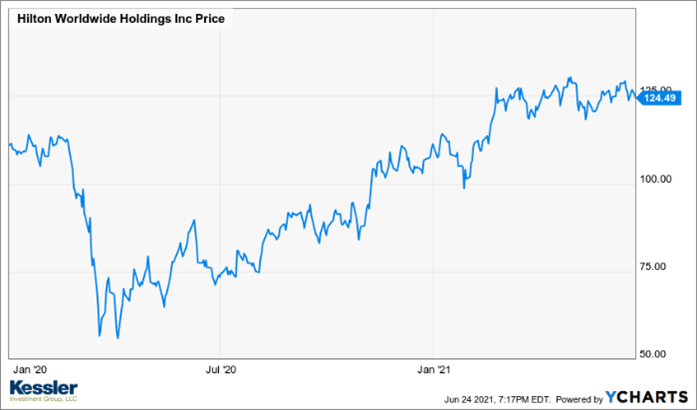
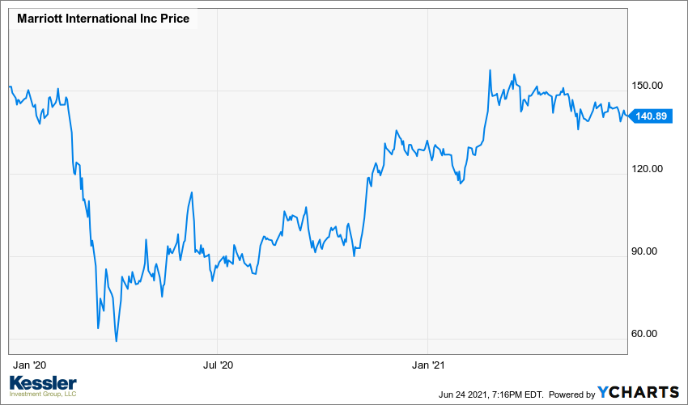
The nation’s largest retailers, Amazon.com and Wal-Mart, have seen their stocks trade higher than levels seen pre-COVID. Auto manufacturers are in a renaissance that shadows what we saw following the financial crisis. Hoteliers like Marriott and Hilton have stocks trading higher than pre-COVID prices. The death of the cruise ship industry, like that of Mark Twain, was greatly exaggerated. And so on…

As we discussed in previous missives, we see many changes to business and consumerism that will lead to tremendous profit growth. It is worth revisiting these changes now that they seem to be firmly entrenched and will have a lasting effect on profits, growth, and consumer behavior.
Personal hygiene habits have changed. Washing hands, cleaning surfaces, staying home when sick with the flu or a cold are all behaviors that will lead to profits. Fewer trips to the doctor, fewer days of work missed are positive for companies and families alike.
Real estate expenses have shifted. Companies realize they can operate with less physical space. They also have discovered that employees are more efficient and work more hours when at home. Employees have cut the cost of getting to and from work dramatically.
Travel behavior has changed. Airlines and hotel rooms have always been havens for transmittable germs. No longer is that true to the same degree. Travelers are more inclined to incorporate COVID-like risks into their vacation plans. So, RV travel, automobile vacations, and other ways to avoid crowded locations will be more popular than ever.
These are examples of how the “future” looks different than it would have without COVID. Humans adapt. Businesses adapt. They do this when the government gets in their way, and they do it when a virus gets in their way. It is why an optimistic view of the future is essential for profitable investing in the long run.
The re-opening is going well for stocks. It is not over. We should continue to see changing data tied directly to the re-opening for several months to come. Nothing is perfect and, as the great thinker Thomas Sowell reminds us, there are always trade-offs. After all, you do not inject trillions of dollars into an economy after completely shutting it down and not expect a few negative reactions. Whether it is labor issues, inflation or higher taxes, no recovery is flawless.
Regardless, the combination of high savings rates, low interest rates, pent-up consumer demand and an uptick in corporate profitability should push stocks higher in the months and years to come.
Inflation: Is it a threat?
Since the Great Recession, we have described the effects of deflation and disinflation on markets and the economy. While neither deflation nor inflation are “good”, deflation is more dangerous. It is what the Fed has been fighting for more than a decade.
To understand the difference between the two forces, let us use the analogy of a car engine. Think of deflation as an engine that has seized while inflation is an engine running too fast. Both may end up being catastrophic but there are more levers available to rein in a hot-running engine than one that has locked up.
The deflation that the Fed has been fighting has acted like a “vortex” swirling beneath the economy. Following the Great Recession, the Fed was left to do all the work to keep deflation at bay. No fiscal stimulus (White House and Congress) was added to the monetary stimulus (Federal Reserve) to ignite the economy. In large part, this explains why the recovery from the Great Recession was so anemic.
In March of 2020, things changed. Along with the Fed stepping up their monetary stimulus in response to COVID, the government enacted an unbelievable amount of fiscal stimulus. A multiplier effect is felt when both monetary and fiscal stimulus are coordinated. We saw something similar during the early 1980’s when “Stagflation” was the threat.
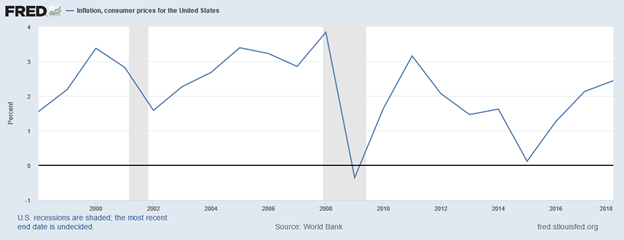
In the charts below, the inflation of the late 70’s and 80’s can be seen. The grey areas represent recessions. To bring down inflation, the Fed raised rates dramatically. This has the effect of stepping on the brake of a car. At the same time, President Reagan was pushing for lower taxes and other economic growth initiatives. This has the effect of pushing on the gas pedal of a car. Together, these efforts broke the back of “stagflation” (high inflation and low growth) and stocks soared.

The next chart shows inflation from the Great Recession through 2018. The same number of years as the chart above. Note that in the chart above inflation started at almost 13% and fell to around 2.5%. In the chart below, inflation has barely stayed above 2.5% and briefly dipped negative.
So, while inflation is certainly picking up. We do not see this as purely a negative event. In fact, we welcome a more sustained inflation to put distance between the economy and the deflationary “vortex”.
The Fed has described the inflation numbers we are seeing as “transitory”. We agree. For now. It is understandable that, as we come out of the COVID shut down, spending will pick up and prices will rise. Critical to this notion is the fact that the personal savings rate increased dramatically during COVID. Individuals “adapted” to the stimulus and shut down by curtailing spending and increasing savings.
The chart below shows that the savings rate has gone through the roof following COVID. Also note the dip in savings rate in 2005. This coincides with the run up to the Financial Crisis. The Crisis was made worse by the low savings rate.
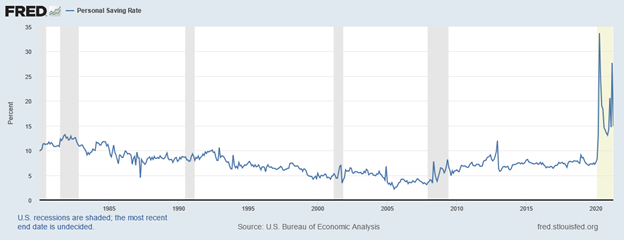
The unleashing of these savings has only just begun. Think of the increase in savings rate as a recharging of consumers’ financial batteries. This energy will not stay stored up forever.
The big question is whether the inevitable draw down in savings will lead to inflation. While many see inflation in its simplest terms (“Too much money chasing too few goods.”), the relationship is a bit more complicated.
Just because there is more money in reserve than recent memory does not mean there is “too much.” While there might be “too few goods” now, we have not seen the supply chain fully come online since the vaccines were released. Further, while the “chasing” of goods has caused a spike in inflation, a dangerous level of the “velocity” of the chase is not appearing in the data yet.
“Velocity” is a measure of the speed at which purchase transactions occur over a period. Velocity does not occur in a vacuum. While velocity might have picked up in the last few weeks, the higher prices that result can also be the force that slows the velocity. Think of the effect of wind resistance on a car as it speeds up. While the engine (economy) might speed up (velocity), the wind resistance (inflation) can act to slow the car.
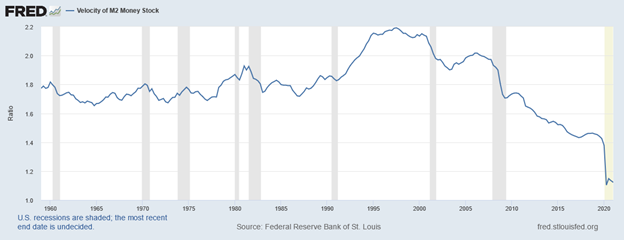
The chart below shows the velocity of the money supply back to 1960. As you can see, the velocity has been slowing since the late 1990’s. This speaks to our observations on deflation over the past 20 years. The decline in money supply velocity has kept inflation in check but recently turned into deflation. A reversal of this trend is important, and we are simply in the early stages of recovery. It stands to reason that inflation will spike from time to time during this recovery without getting out of hand.
We have a long way to go before inflation becomes the problem it was in the 1970’s. The Fed has plenty of levers to pull to rein in inflation before it becomes a problem. Our view is they are content to let inflation run a bit hot to fully snuff out the forces of deflation in this economy. This means the cries from those fearful of inflation will grow louder before the Fed begins to taper its stimulus.
Another reason for the Fed’s view that the spike in inflation is transitory is supply. As I mentioned above, if supply increases to match demand, this will dampen inflation. After all, the equation needs “too few goods” being chased by “too much money.” If “too few goods” turns into “enough goods”, then prices will stabilize as the supply/demand relationship evens out.
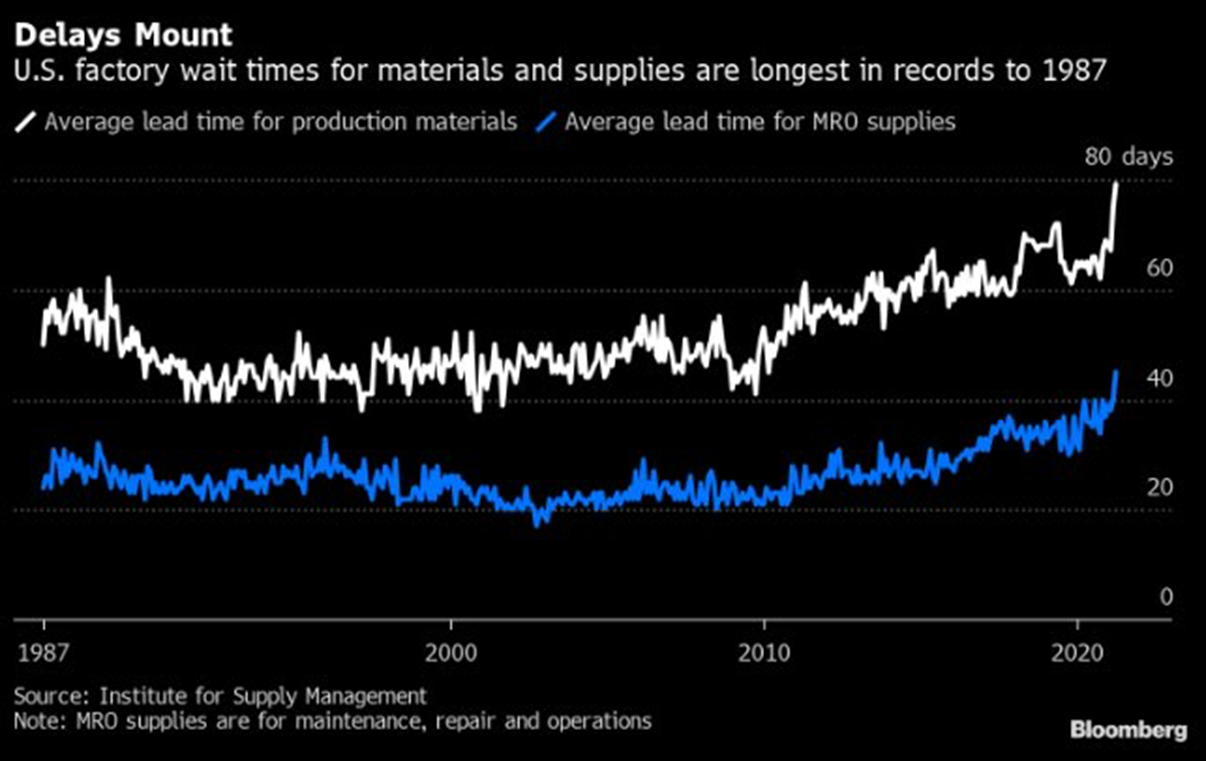
The chart below shows how stretched the supply chain is right now. It is unlikely that this spike in wait times will persist for much longer before supply comes online. When it does, it should help to push inflation pressures lower.
The Fed will be patient as it waits for evidence that supply is coming online. They realize that consumer demand picks up much quicker than the supply chain. It is one thing for consumers to grow confident enough to leave their homes and go on trips. It is another for the supply chain to return ramp up to normal at the same pace.
Our Short-, Intermediate-, and Long-term Forecast for Stocks
Stocks look stretched in the short-term. We have felt this way for a few months, but stocks have continued to plod higher albeit modestly so. Since April 15, stocks have made several all-time highs, yet the S&P 500 Index is higher by only 2.3% over this period. So, while stocks sit near an all-time high, they have muddled higher more than rocketed higher.
Importantly, as stocks have creeped higher, the number of new 52-week highs has declined. When this trend develops it indicates that while the broad stock market average is moving higher it is doing so on the shoulders of fewer and fewer stocks. This is known as a “narrowing” market and is not a sign of a healthy market.
Additionally, stocks look stretched due to the number of them trading above their 200-day moving average. When this measure gets near 100% it suggests that stock prices have moved higher across the board. It is a rare occurrence for the S&P 500 Index to see nearly 100% of its member stocks trade above their 200-day moving average. As the chart from Yardeni Research below shows, when stocks get this extended, they usually do not stay there long.

With these data points in mind, we are cautious about stocks in the short-term. A 5-10% sell-off seems reasonable to us. That said, we see that stocks could move higher by a few more percentage points before weakness sets in.
In response to this view, we have moved our managed accounts to a higher-than-usual cash position. There is nothing more frustrating than holding cash while stocks move higher. However, we believe it is prudent to respond to these indicators.
While our short-term forecast is cautious about stocks, our intermediate-term view is more bullish. The underpinnings of the economy remain strong. The savings rate, as shown earlier, is high. Interest rates remain historically low. More fiscal stimulus from the government appears to be on the way and corporate profitability is still in an uptrend that should last for many more years.
This bullish view takes us through the mid-term election cycle. This is when we expect to see another peak in stock prices that should be monitored. The threat to stocks will likely come from the Federal Reserve finally raising interest rates along with a hike in tax rates.
The confluence of these forces will be too much for stocks and the economy. It is likely that a recession will follow the mid-term election as growth slows, the Fed hikes rates and Congress raises taxes. Until then, we think short selloffs will give way to higher stock prices. So, “make hay while the sun shines” comes to mind as the approach to take with stocks. That is, the recovery from COVID will last longer than many folks think with only “refreshing” selloffs along with way to dampen enthusiasm.
Our long-term view remains firmly bullish. We believe the current market cycle, which began in 2016 still has a decade to go. We are in a cyclical bull market that should last until around 2032. We expect it to resemble the bull market that went from 1982 through 1999. This was a period that was marked by the 1987 crash, the 1990 recession and the Asian financial crisis of 1998. Despite these noteworthy downdrafts in stocks, the S&P 500 Index went from 150 in 1982 to 1,500 by 1999. A 10-fold move that would have been unthinkable in 1982. It is our view that the same kind of “unthinkable” move from the 2,000 level of the S&P 500 Index that occurred in 2016 could lie ahead. If so, then the current 4,300 level of the Index could move to 20,000 by 2032.
In conclusion, we remain cautions as stocks sit at stretched valuations. If we are correct, and stocks do take a 5-10% “breather”, we will be buyers again. Our focus will be on sectors that will benefit from inflation, consumer demand and post-COVID behavior. This means banks, healthcare, energy, commodities and hi-tech are in our cross hairs.
Our intermediate term view is less cautious but with an eye on the 2022 mid-term elections. A recession might be in the cards in a couple years as the Fed and Congress act in response to inflation and rising deficits.
Long-term we remain bullish. The current trend should be intact for many years to come with only refreshing selloffs with which to contend.
As always, we appreciate the trust you place in Kessler Investment Group to manage your precious nest egg. We strive to navigate the ever-changing markets to deliver results without taking on undo risk. We welcome your comments and questions as we look forward to the future.
Sincerely,
Craig Kessler, Chief Investment Officer
All information above is believed to be from reliable sources; however, we make no representation as to its completeness or accuracy. All economic performance data is historical and not indicative of future results. The market indices discussed are unmanaged. Investors cannot invest in unmanaged indices. Certain statements contained within are forward looking statements including, but not limited to, statements that are predictions of or indicate future events, trends, plans or objectives. Undue reliance should not be placed on such statements because, by their nature, they are subject to known and unknown risks and uncertainties. Please consult your adviser for further information.
Opinions shared are not intended to provide specific advice and should not be construed as recommendations for any individual. Please remember that investment decisions should be based on an individual’s goals, time horizon, and tolerance for risk.