
Thoughts on Today’s Selloff
The S&P 500® Index (“SPX”) was down over 4% at the lows today. This follows a day that saw stocks rally by 3%. To be sure, these are extreme levels of volatility, but I am more amazed by the hysteria whipped up in the business media. Advertising dollars are harder to come by lately, so a good washout in the stock market is just what the doctor ordered for CNBC and others.
To add a little context to today’s selloff, the SPX has fallen to levels it has not seen since……yesterday morning. Furthermore, the SPX is almost 2% higher than it was at 2pm on Monday…. three days ago. Without this context, many investors might think a major crash had occurred in the market today if listening only to the news channels. While volatility has been high, stocks have neither gained nor lost much ground this week. We expect this to be the trend for a while longer.
When stocks hit a rough patch, the negative case for stocks frequently sounds more sophisticated and reasonable than the bullish case. Yet, look at any chart of the SPX over any 10-year period and you will see it goes from the lower left to the upper right. In other words, despite all the reasons for stocks to decline to zero, the charts show something different has happened historically. The chart below helps put this into perspective. It shows the probability of positive stock returns based on time periods going back to 1926. (Past performance does not predict future results.)

While we maintain a positive view on stocks longer term, we expect the next few months to be frustrating. “Volatile” and “choppy” will be the most popular adjectives to describe the stock market during the next few months. This volatility should not be seen as a precursor to a market crash. As investors adjust to a new Fed cycle, the post-COVID business cycle and persistent inflation, volatility should be expected. These are periods that come and go for seasoned investors. They are normal and natural and help to burn off excesses that have built up during extended rallies.
During periods like this, our primary focus here at KIG shifts from capturing total return to capital preservation. Additionally, we sharpen the pencil as we work to increase the quality of the portfolios we manage. Once we emerge on the other side of this period of volatility, stocks will rally, and we want to make sure client portfolios are positioned to take advantage such a rally. There is usually a different character to the rally that follows a consolidation period like this than the one which preceded it.
We expect stocks to stage a few 10% rallies through the 2nd and 3rd quarters. Unfortunately, these rallies will likely be followed by declines that erase the gains but little more. As this “long hot summer” of a market drags on, stocks will work off the excesses of the last two years and then some. Not every stock will fully recover in price, but those companies in the right sectors with strong balance sheets, high profitability, and seasoned management teams will see their stock outperform.
Some people might be frightened into thinking it is “time to get out” of stocks. The notion that there ever is a “time to get out” of stocks or a “time to get in” to them, is one best suited to gamblers and not investors. While we use cash as an important tool to reduce risk in our client portfolios, we never think in terms of an all-or-nothing approach to investing. Investing is a process and should never be confused with gambling moves like “Put it all on red.” or even “Once I lose my $20, I’m out.”
While there are thousands of examples, one need only look at March of 2020 as an example of the cost of the “time to get out” approach. Any “investor” who pulled their money out of stocks in March of 2020 might have felt vindicated for a few days, but within 18 months the SPX doubled in value. A costly decision for sure. (Past performance does not predict future results.)
As we headed into COVID two years ago, we told clients that we were buying stocks that would perform well during the post-lock-down recovery. Now we are shifting to stocks that we think will perform well as the Fed removes the liquidity it injected during the crisis. Additionally, we told clients in 2020 that there would be “unintended consequences” to the unprecedented amount of stimulus injected into the economy, but that these consequences would be better than the alternative. We believe this has proven true as the economic issues we face today are tame compared to what we would have faced were no stimulus used at all.
Below are three charts showing how the SPX has performed this year, the last 12 months and since the pre-COVID level on February 14, 2020. A 22% return during a 2-year period that included a global pandemic, shutting down of the U.S. economy, nationwide riots, and any other items one might want to add, is certainly not a bad return. It is difficult to imagine where the SPX would be if it was not for the quick action taken by the Fed. A 10-15% correction this year is a small price to pay for what might have happened otherwise.
Where are Stocks and Bonds Headed
Overall, we see stocks as attractively valued. However, our view is not Pollyanna. We take seriously the challenges facing the stock and bond markets. We are working hard to stay on top of the risks the economy is facing. The war in Russia will influence the global economy for years. Inflation is hurting corporate profits and eroding consumer spending power. The China lockdown negatively affects demand for U.S. goods and the global supply chain.
However, as we have written to clients many times, here at KIG we work hard to measure the “temperature” of the markets and the behavior of investors. We want to recognize when extremes in sentiment are reached. When we do this well, it helps us temper our enthusiasm during periods of euphoria and lift our enthusiasm during periods of despair. We do this because experience has taught us that contrarian investing can be more profitable than running with the herd.
Currently, we sense that fear and despair are setting in with investors. This suggests to us that we are nearing one of those 10% rallies discussed earlier. Stocks hit their low this year way back on Monday of this week. After a 5% rally and decline, we find stocks hovering just above Monday’s low. Could stocks break below Monday’s low? Absolutely. We do not think such a break would last before buyer’s step in.
The economic data is still too solid, and cash is still at high enough levels for a crash to take shape. Stocks have had every opportunity to go down further and yet we are only 13% off all-time highs. Sentiment surrounding the market might lead one to believe stocks are down 25% and will never regain their footing.
This negative sentiment we sense is positive for stocks during this period of consolidation. It helps to build a solid base for stocks to eventually launch a rally. One we think is coming later this year. Sometimes the SPX needs to “tread water” as it works off excesses and builds “energy” to move higher. We think this is one of those times. Let us look at some of the more critical data that brings us to this conclusion.
Yesterday, the Federal Reserve raised interest rates 50 basis points or ½ of 1%. This means they are applying the brakes to the economy to slow inflation. The chart below shows the history of rate hikes since 2000. As you can see, this is the fourth time the Fed has embarked on hiking rates since the late 1990’s. In each of the previous rate cycles, stocks eventually sold off by at least 20%.

Will this series lead to a fourth crash for stocks? We don’t think so for one main reason. In each of the previous rate cycles, stocks rallied before and during the hikes. Eventually, the rate hikes “broke” stocks and a bear market ensued. This time, stocks entered a bear market BEFORE the Fed started hiking rates. Could this mean that the Fed will still “break” stocks and the decline will get even worse? Anything is possible, but we believe the economy is much stronger than previous cycles and much of the risky excess of stocks burned off before the Fed got involved.
In addition to stocks, bonds have suffered declines this year. It is worth noting that it is highly unusual for stocks AND bonds to decline in tandem as they have this year. We do not expect this trend to last much longer. This means we expect bonds to rally as rates are now at levels that attract investors. (Remember that as bond prices go down, yields go up and vice versa.)
This is important because if we see a turn around in bond prices, this will also take pressure off stocks as yields come down. It does not mean stocks will be in the clear, but it will provide critical support in terms of stock market valuations. Again, it takes time for stocks to find their footing so patience is important before the “all clear” signal is given.
If inflation gets out of control, the Fed might need to raise interest rates faster and higher to reign it in. The rub is that if the Fed applies the “brakes” too hard (raises rates too much), it can send the economy into recession and lead to an increase in unemployment. Many investors fear that the Fed will make such a mistake and push the economy into a recession. This explains the high level of fear that we detect in the market. While this is a legitimate fear, we believe economic growth will not evaporate just yet and inflation will moderate significantly. If we are right, the downside for stocks from current levels is limited. In fact, we think 4,000 for the SPX (give or take) is where solid support exists for stocks. This suggests 3-5% downside risk remains for the SPX. However, we also believe stocks could see new highs later this year or into next year. If we are right, this suggests the SPX has 15-20% upside from current levels.
For our view to be more right than wrong, we need to see inflation moderate without a significant decline in corporate profits or consumer demand. So far, corporate earnings for the first quarter have come in strong and credit card, bank and retail numbers suggest demand is still robust.
A term that has been dusted off lately is “stagflation”. While I was not a professional in 1981, I do remember the economic malaise during that time, albeit through the eyes of an 11-year-old. More importantly, I have studied that time in our history and understand the factors that led to it. Simply put, the forces that brought about the stagflation of the late 70’s and early 80’s are not fully present today.
Yes, inflation is elevated, and economic growth is beginning to cool. However, signs of moderating inflation are popping up and could lead the Fed to soften their approach to raising interest rates. If this happens, economic growth could re-accelerate.
Below are a few charts that suggest prices might have peaked last year. If these signs of lower prices continue, the need for the Fed to raise rates dramatically, will disappear.
Chart 1: Durable goods orders peaked in mid-2021
Chart 2: Global prices of commodities peaked in mid-2021
Chart 3: US gasoline prices peaked in mid-2021
Chart 4: WTI crude oil prices peaked in mid-2021
Chart 1-
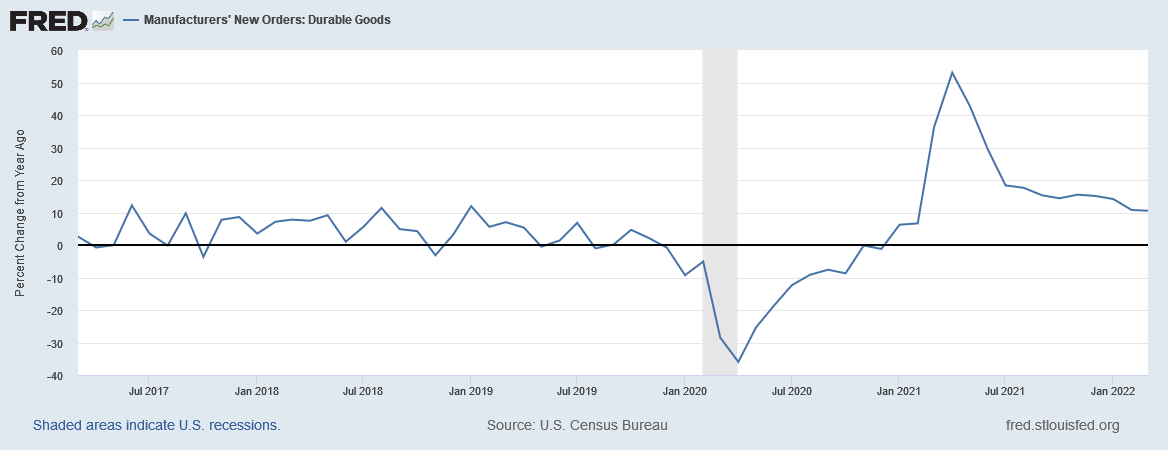
Chart 2-
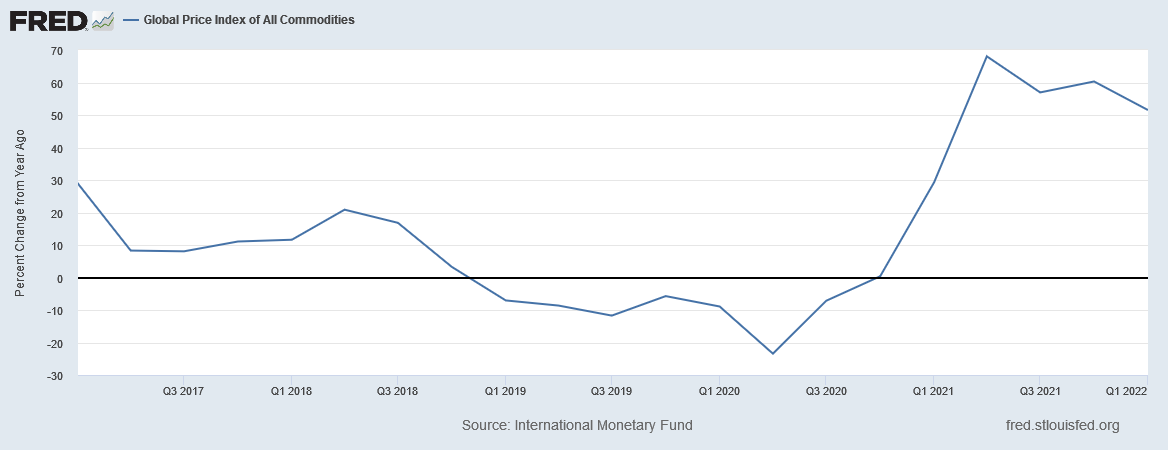
Chart 3-

Chart 4-

These charts are important as the Federal Reserve is looking for the market to do its bidding. In other words, if the economy slows on its own, as these charts are showing, then the Fed will not need to raise interest rates as much which can reduce the risk of a recession.
It is important to understand that the Fed is limited in the way it can control the economy. The main tool of the Fed is interest rates. However, now the Fed has a second tool in the form of Quantitative measures whereby it can buy and sell Treasuries and mortgage-backed bonds. This gives the Fed a new level it can push or pull to fine tune monetary policy.
By adjusting interest rates and other monetary activities, the Fed can affect DEMAND. But it cannot affect SUPPLY. This matters because the Fed has told us it believes the main culprit driving inflation higher is supply chain disruptions. This means they are keen to see supply disruptions correct so they do not need to pressure consumer demand. Why? Well, if the Fed pushes demand down too much, a recession becomes a real risk. If the supply chain comes fully online, this can bring prices down without damaging demand and therefore support economic growth.
Remember from school that inflation is caused by “too many dollars chasing too few goods.” Between the Fed’s aggressive monetary stimulus during COVID, we have “too many dollars.” Also due to the COVID lockdowns, the global supply chain was knocked offline leading to “too few goods.” Herein lies the rub. The Fed does not need to reverse all the stimulus if the supply chain comes online soon.
To reduce the amount of “dollars”, the Fed raises interest rates and/or sells their holdings of Treasuries and mortgage bonds. However, if the supply chain can come back online, the “too few goods” issue might turn into “just enough goods” and match the amount of demand. This is a scenario we believe very well could happen.
If we see global supply increase along with some modest rate increases from the Fed, it is possible the economy can continue growing, inflation subsides, and recession is averted. We think this is a real possibility and could boost stock prices in the process.
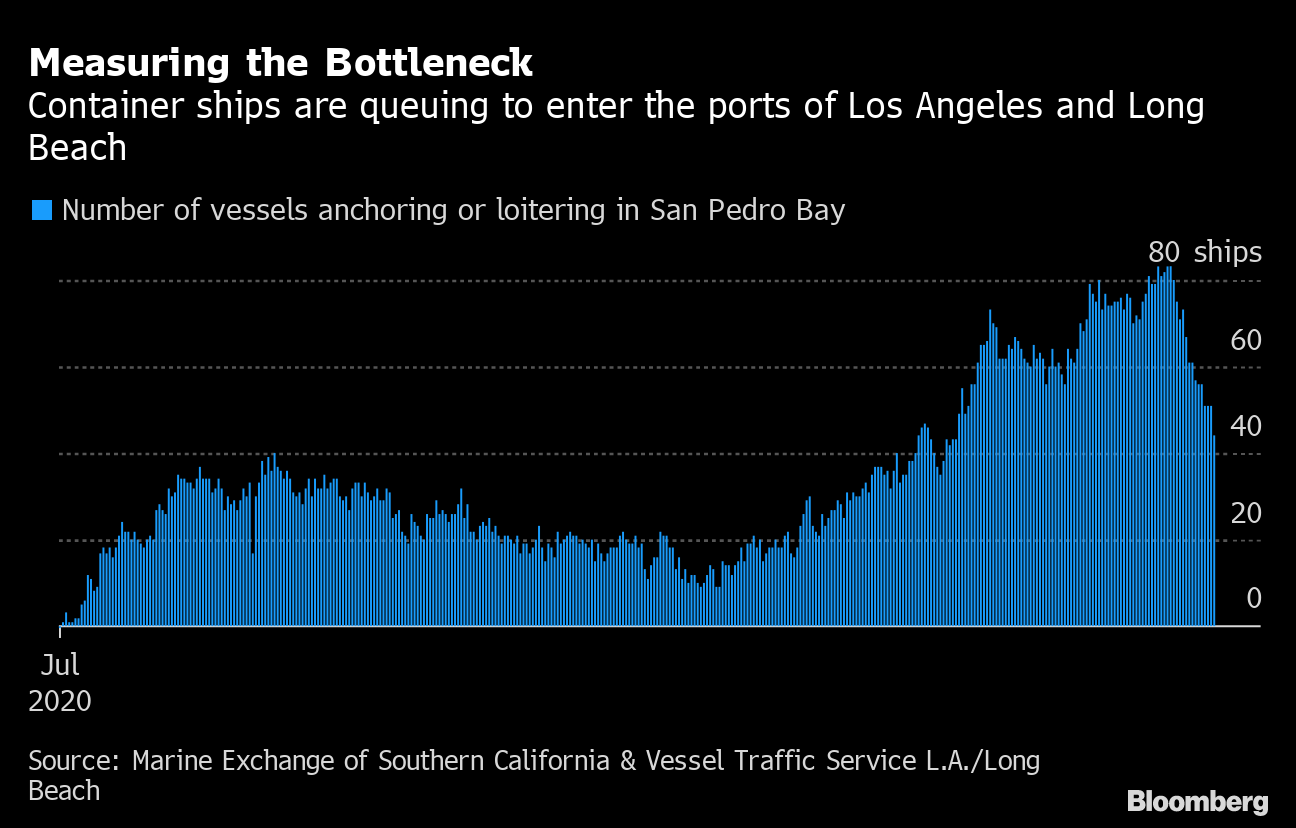
The two charts below show signs of the supply chain coming online. Chart 1 shows the number of ships anchored off Long Beach, CA has dropped by more than half since 2021. Chart 2 shows the U.S. Supply Chain Index is moving toward normal efficiency.

Conclusion
Stocks are likely to rally soon by maybe 5-10%. Such a rally will likely be capped but so should any decline that follows it. While we expect the stock market to be volatile (up and down) for the next few months, we expect a rally to develop into the end of the year. It is possible we could see the SPX make a new all-time high by the end of the year or early into next year.
We are shopping for stocks that we think will benefit from such a rally at the end of the year. Our sector focus will be on the Technology, Materials, Energy, Healthcare, Financials and Communications sectors. We think it will be harder to find strong candidates in the Utilities, Industrial, Real Estate, Consumer Staples and Consumer Discretionary sectors.
Longer term, our attention is set on the Metaverse and the possibility of a food crisis as we look for opportunities. We believe the Metaverse will deliver similar results as the Internet did in the 90’s. We will discuss in more detail our thoughts on the Metaverse in future commentaries. The food crisis is likely to result from the war in Ukraine and rising commodity costs. We do not think the crisis will lead to mass casualties around the world, but we do believe prices will move much higher and the demand on agricultural technology will increase dramatically. Stay tuned for more thoughts on these two topics.
Sincerely,
Kessler Investment Group, LLC
All information in this presentation is believed to be from reliable sources; however, we make no representation as to its completeness or accuracy. All economic performance data is historical and not indicative of future results. The market indices discussed are unmanaged. Investors cannot invest in unmanaged indices. Certain statements contained within are forward looking statements including, but not limited to, statements that are predictions of or indicate future events, trends, plans or objectives. Undue reliance should not be placed on such statements because, by their nature, they are subject to known and unknown risks and uncertainties. Please consult your adviser for further information.
Opinions shared in this presentation are not intended to provide specific advice and should not be construed as recommendations for any individual. Please remember that investment decisions should be based on an individual’s goals, time horizon, and tolerance for risk.