
“Never miss out on an opportunity like a good recession.” – Jack Welch
“I’ve heard there’s going to be a recession. I’ve decided not to participate.” – Walt Disney
The recession is upon us. We have revised our view that the recession would be a 2023 story and believe it began following the spike in oil prices in March. The sequence of events from here is important for investors to understand. Many investors will make the mistake of investing based on the flow of economic data rather than what the stock and bond markets tell us.
Ahead of previous recessions we see similarities to what markets were telling us earlier in the year. In the first chart below, we see the rhythm of spiking oil prices followed by recession. I have marked in red the spike in oil prices that preceded or coincided with a recession.

In the next chart, we see a similar relationship between low unemployment and recession like we did with oil. I have marked in black the excessively low unemployment levels. I have marked in red the spikes in unemployment. Unemployment tends to bottom ahead of a recession and peak as we exit recession.

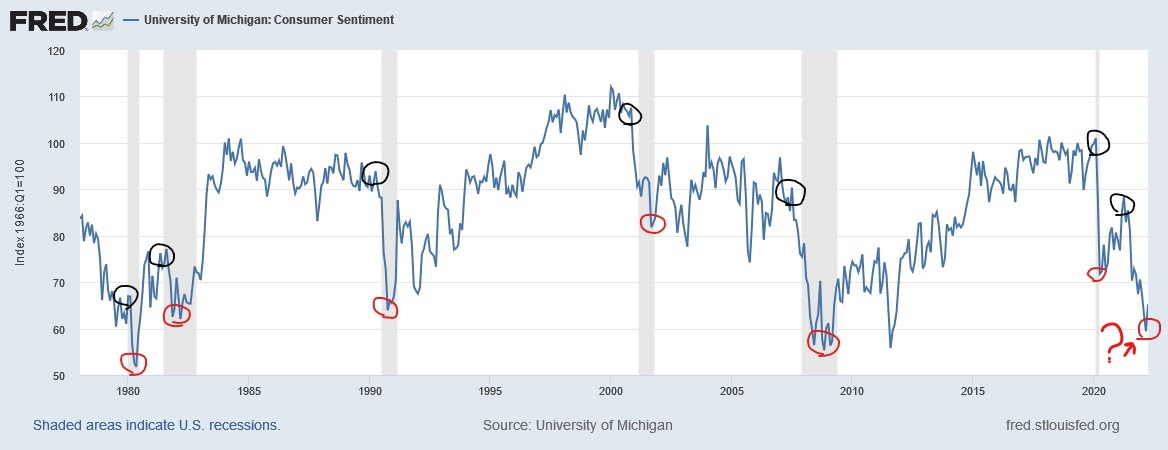
The final chart illustrates the moves in consumer sentiment. In recent days, the Fed Chairman pointed to the dramatic drop in consumer sentiment as the reason for the committee’s decision to raise interest rates by 75bps rather than the expected 50bps earlier this month. The chart shows how rapid declines in consumer sentiment have preceded recessions. This drop in consumer sentiment is exceeded only by the drop in 2008 and 1980.
Central to our approach is the 17-year cycle for stocks. Below is the chart posted on our website. The chart shows the price action of the Dow Jones Industrial Average (“DJIA”) from 1897 through 2016 with a prediction of the value the DJIA might reach by 2033.

While the differences between these periods, in terms of technology, fashion, etc, is obvious, the similarities take some time to identify. Therefore, the similarities are more valuable to investors than the differences. The similarities are hidden by the differences, but they are there. It is where you find the effect of technological advances, the effect of human nature, and the forces that drive stock prices.
Since 2016, stocks have been in a bull market. Therefore, it is worth looking at the previous bull market (1982-1999) for clues about how stocks might act. Let us take a quick look at the chronology to see if we recognize similarities.
In 1982, the Federal Reserve was dealing with runaway inflation and sluggish growth. There was also an elevated level of skepticism that inflation would be reined in. The stock market crashed 4.5 years later in 1987. Three years later, in 1990, a recession began around the same time as a military conflict in the Middle East erupted. Stocks declined by 20% ahead of the onset of the recession. Following the end of the Gulf War, stocks began a multi-year rally that would take the DJIA to what would be an 1,100% gain by 1999.
If we are correct, the current bull market started in 2016 at time when the Fed was dealing with runaway deflation (inflation and deflation are two sides of the same coin) and sluggish growth. There was a high level of skepticism that the Fed would successfully fend off deflation and invigorate growth. The stock market crashed 4.5 years later in March of 2020 when the word COVID entered our vocabulary. Here we are, almost 3 years later, dealing with a recession (our call) and a conflict in Europe. Stocks have declined 20% since the beginning of the year and ahead of an official declaration that we are in recession.
Will stocks rally like they did following the 1990 recession? We believe they will. It was the commercialization of the Internet that drove growth during this period. We think augmented reality will be the driver this time around. Our investment thesis will focus on companies that benefit from this trend.
As for the recession, stocks began to hint of an inflation-led recession in November of 2021. It was the high-growth stocks that had done so well during COVID that began to tumble first. Many of these stocks have fallen to lower prices than they traded at BEFORE the pandemic. Here are some examples of stocks that peaked in 2021 along with the percentage drop from peak to trough:
- DocuSign (sym: DOCU): -82%
- Zoom (sym: ZM):-80%
- Peloton (sym: PTON)-93%
- Wayfair (sym: W)-86%
- Carvana (sym: CVNA)-95%
These “stay at home” stocks were telling us that higher interest rates were ahead. That valuation multiples would be adjusting downward as interest rates went upward. The “Dot Com” bubble of the early 2000’s comes to mind when we see a whole cohort of stocks get bludgeoned like this. Some of these stocks will recover, many will not.
The last time the Fed raised interest rates was from December 2015 through December 2018. At that time, the Fed was anxious to return rates to “normal” following the Financial Crisis. They wanted to “reload” interest rates to be prepared for the next economic downturn. What was missing back then that is quite present today is inflation.
It turned out that the Fed has raised rates a bit too much back in 2018 and allowed DEFLATION to reignite. A mistake that was certainly on the mind of the Fed Chairman as he held off raising rates too long into 2022. Now we find the Fed scrambling to get ahead of the inflation they have been longing for since 2009. Make no mistake. They will get ahead of inflation. So much so that they will eventually need to backpedal as the recession worsens.
At this point, we want to be clear. The recession should be shallow and last only a few months. In fact, we still expect to see areas of growth in the economy as the recession hits other areas harder. A slow growth recession as opposed to a negative growth recession, is what we expect.
The inflation that once was called “transitory” is now enemy number one for the Fed. However, we see inflation coming off the boil even before the Fed gets to its interest rate target of 3.8% later this year. It is our view that inflation will come down enough in the most troublesome areas (Oil and Commodities, but not Food), that the Fed will turn its attention to the economy once again. It will be this shift, away from inflation and toward employment and the economy, that we will see the Fed pull back from higher rates.
The chart below shows the NYSE Arca Oil Index which is comprised mostly of the largest oil companies in the world. Clearly the trend higher has been broken in recent days. We do not expect oil prices to exceed the peak of earlier in the year. Eventually, this will lead to lower gasoline prices.

This chart shows that oil supply continues to come onto the market through more oil rigs coming online. As more supply enters the market, prices will moderate.

Finally, the commodity chart below shows that raw material prices has peaked too.

Using the 1990 recession as a guide for the recession we find ourselves in today is helpful. The charts above line up with what we saw in 1990. Interest rates were rising, inflation was an issue, consumer sentiment plummeted, and an aggressor started an armed conflict with its neighbor. Back then it was Iraq vs Kuwait while today it is Russia vs Ukraine.
In the chart below we set up the sequence of events by looking at how stocks reacted during the recession. Officially, the recession began in July 1990 and ended in March 1991. These two periods have been marked in red on the chart. We believe the current recession will show to have started as early as March of 2022. We expect data to show we will have exited the recession by the end of this year or some time in the first quarter of 2023.

What is important to remember about the 1990 recession was that the “experts” did not agree that a recession was inevitable in July of 1990. By October of 1990, stocks had entered a bear market down 20% from the July peak. By February of 1991, economists had accepted that the U.S. was in recession, yet stocks had recovered all their losses since July.
It was not until early 1992 that unemployment peaked, the economic “fever” broke, and the economy began to grow again. However, by that time, stocks had rallied by 42% from their October 1990 lows and 13% from the precession high of July 1990.
Here are some news articles during the 1990 recession along with the level of the S&P 500 Index at the time the article was written.

S&P 500 Index on July 1, 1990: 358

S&P 500 Index on October 1, 1990: 306

S&P 500 Index on February 17, 1991: 369
Following the 1990 recession, stocks embarked on an incredible run into early 2000. As our 17-year chart above suggests, we think stocks will rally significantly to 2032. Below is a chart of the S&P 500 Index from 1992 through the beginning of 2000.

Investors who wait for the “all clear” signal from economists or the press can miss massive gains in stocks. We believe the same will be true this time as well.
In conclusion, we expect stocks are near their lows not only for the year but for the long run, too. Economic data will continue to come in showing a weak economy. This data is backward-looking and will miss what stocks see in the future which is moderating inflation and economic growth. Investors who hold high quality stocks will be rewarded for their patience heading into the second half of 2022. We expect a bit more volatility in the near term, but stocks should begin to rally in the next 4-6 weeks.
PAST PERFORMANCE DOES NOT PREDICT FUTURE RESULTS
Sincerely,
Kessler Investment Group, LLC
All information in this presentation is believed to be from reliable sources; however, we make no representation as to its completeness or accuracy. All economic performance data is historical and not indicative of future results. The market indices discussed are unmanaged. Investors cannot invest in unmanaged indices. Certain statements contained within are forward looking statements including, but not limited to, statements that are predictions of or indicate future events, trends, plans or objectives. Undue reliance should not be placed on such statements because, by their nature, they are subject to known and unknown risks and uncertainties. Please consult your adviser for further information.
Opinions shared in this presentation are not intended to provide specific advice and should not be construed as recommendations for any individual. Please remember that investment decisions should be based on an individual’s goals, time horizon, and tolerance for risk.