
During the first quarter, equity prices continued their move higher following the presidential election. This was mostly in line with our expectations as we were almost fully invested through the end of the year. Our enthusiasm gave way to a sense of caution mid-way through the first quarter. Market indicators we follow suggested a pause in the rally was nearing.
In response to these signals, we raised cash (sold stocks) to over 20% in our managed portfolios. Ultimately, this cautious move proved unnecessary as stocks did not do any more than take a pause. The S&P500®Index did deliver a slightly negative result in the month of March (-0.4%) but the Dow Jones Industrial Average and the NASDAQ delivered slightly positive results.
So, while our decision to raise cash did not coincide with a drop in the market, it offers a glimpse at our portfolio management approach to managing risk. When our indicators (and experience) suggest the market is ripe for a pull-back, we will take corrective action. We will never be right all the time. However, when we are wrong, it is our goal to be overly cautious rather than overly aggressive.
In addition to raising cash in our managed accounts, another decision worthy of note was to invest in gold and a gold miner. We believe the bottom is in for the precious metal. While it is too soon to call for a $2,000 an ounce price, we do expect to see $1,500 this year. In the face of a strong U.S. dollar and rising interest rates, this adds to our enthusiasm for equity prices into the future. A similar pattern developed during the early 1980’s at the beginning of a massive economic expansion. We expect to see the U.S. economy expand dramatically over the next decade and the data we see right now supports this view.
As we settle further into the post-election environment, investors remain on the edge of their seats. The new president has kept markets on edge as the docket of agenda items remains full. While the news outlets remain fixated on President Trump’s every move, our focus is on the underlying economic data to determine the direction of markets. We expect the Federal Reserve to influence markets significantly through this year and into next.
While equity markets remain bumped up against “all-time highs”, there really has been little movement higher since the early part of the first quarter. As mentioned earlier, the S&P500®Index posted a slightly negative result for the month of March. This period of marking time for the equity markets will likely be a set-up for a more significant move later this year, if not later this quarter.
We continue to hold the belief that markets are at the beginning of a 17-year growth cycle which will be reminiscent of the 1982-1999 period. In the first few years of that period, markets experienced significant volatility before the upward trend took root. To wit, prior to the passage of President Reagan’s sweeping tax reform, equity prices fell by approximately 30%. This marked the “last gasp” of the bear market which frustrated investors over the prior 17-year stagnant cycle. Will we see a similar decline before President Trump’s sweeping tax reforms are passed? Time will tell, but we are looking for history to rhyme.
So, while our radar is searching for any near-term weakness in stocks, our long-term view remains quite optimistic. Investors who are expecting a crash in stock prices will become increasingly frustrated. We expect corrections to be of the “garden variety” magnitude and short in duration.
To some this optimistic view may be difficult to grasp. It is a popular view that because the S&P 500 Index has more than doubled from the March 2009 low, there is no steam left in the market. While it is true the market has doubled since the Financial Crisis, stocks have spent most of the last 17 years simply recovering after significant declines. A frustrating period for most investors. The same can be said for the period between 1965 and 1982. An important comparison to make to be sure.
We point to the fact that while the S&P500® Index has more than doubled since March 2009, it has not doubled since the end of 1999. To us, it is much more important to view the market’s performance since 1999 rather than the end of the Financial Crisis. It offers a clearer picture of how frustrating this period has been for investors. It also does not seem to capture the attention of the new media who is all too quick to point out the latest rally or the latest decline. It does more for their ratings than pointing to how stagnant the equity market has been for the last 17 years. Again, this has an important effect on the psychology of investors.
The 17-year cycle that just ended has been marked by two major sell-offs. The first one came during the 2001-03 period when we saw the S&P500® Index deliver three consecutive years of double-digit negative returns. The second decline during 2008/9 took the index down by 50%. These declines and subsequent rallies wear on the patience of investors and has led to record levels of cash sitting on the sidelines and out of stocks. Exactly what needs to be in place for stocks to rally from current levels.
The previous 17-year cycle of stagnation occurred from 1965-1981. At the beginning of this period the Dow Jones Industrial Average stood at approximately 1,000. In 1973/4, equity markets declined by 50% only to recover back to 1,000 by 1980. That means stocks rose by over 100% from the 1974 low through the end of 1979. Not a period that is remembered as being a bull market for equities. In fact, the August 13, 1979 edition of Business Week carried the headline, “The Death of Equities”.
This headline captured the sentiment of the day which centered on stocks being “risky.” Over the next 20 years the Dow Jones Industrial Average would rise 11-fold. Keep in mind this was after they had doubled over the previous 5 years. A similar move in the Dow Jones Industrial Average over the next 20 years would put the index at 220,000!
Over the last several years, we have detected similar indicators lining up as they did prior to the previous cycle of growth that lasted from 1982-1999. The most important indicator is sentiment. Finding anyone, professional or casual observer, who believes stocks are about to embark on a decade-plus rally reminiscent of the previous cycle, is difficult. This is important because if there was a popular view that stocks would rally for over a decade, “everyone” would be putting their hard-earned money into the market. This would lead to an over-invested market where everyone who wants to invest has done so. This would leave no one to enter the market and raise prices. This very scenario is what contributed to the market peaking in 1999. Enthusiasm for stocks was at a fever pitch. No such enthusiasm is being detected at present. More importantly, it is like the Business Week headline from 1979.
For stocks to rally for more than a decade, the market needs “fuel” in the form of investment capital. When enthusiasm for stocks is low, this investment capital begins to pile up. When consumers reduce spending, and increase saving, investment capital begins to pile up. When corporations reign in capital expenditures, investment capital begins to pile up. Following the “near-death” financial experience of the Financial Crisis, consumers and corporations changed their behavior and began to build their cash reserves. The chart below is one piece of evidence that this has happened. It shows how household debt service payments-to-income has decreased since the Financial Crisis.
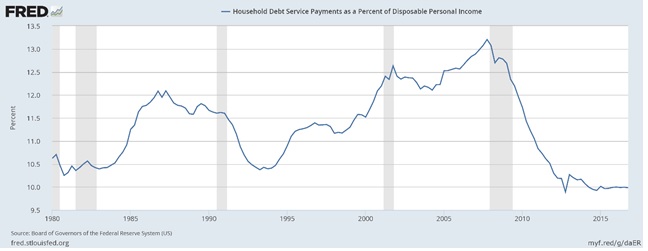
This chart shows how much de-leveraging has occurred since the Financial Crisis. While there is abundant anecdotal evidence that consumers are levering up their balance sheet once again, the data does not support such a reality. The “financial batteries” of consumers has been recharging since the Crisis and is now at levels not seen since before the beginning of the last 17-year growth cycle.
Here at KIG we believe the equity market is at an inflection point. As represented in the chart below, we believe the recent rally in stocks, which is simply a recovery from the Financial Crisis, will soon turn much higher. Our sense is that the political environment will play a role in affecting investor sentiment, and therefore timing, of this move higher. So, we are looking at the mid-term election as a moment when stocks will accelerate higher.
This is an important time for the KIG investment strategy. Central to our thesis is that the principles of “active” and “passive” investing are important despite how different they are from one another. What matters most is the type of market in which these principles are applied. This inflection point represents a transition from one type of market to another. We expect stocks of the largest companies to outperform those of smaller companies over the course of this cycle. Additionally, companies that deliver superior top-line revenue growth will outperform those with slower-growth (and higher yields).
So, in our managed accounts, we anticipate shifting gears to focus on companies that exhibit these characteristics. That said, we also expect to see commodities perform well, too. As companies accelerate growth and expansion, more and more commodities will be used. Inflation, too, will likely pick up as the economy expands. This will lead to a rise in the price of precious metals such as gold.
Before we get too carried away with such an optimistic view of the future, understand that we continue to hold on to a healthy amount of caution. The market will hit turbulence from time to time. There will likely be a hangover from the post-election rally. We want to do what we can to limit damage to performance during these rough spots. We will never lose sight of what we are hired to do for clients. That is to deliver performance while managing for risk.
Sincerely,
Kessler Investment Group, LLC