
“You can observe a lot by just watching.” – Yogi Berra
“A nickel ain’t worth a dime anymore.” – Yogi Berra
“We made too many wrong mistakes.” – Yogi Berra
We find ourselves in the midst of what historically is the worst stretch for stocks on the calendar. While stocks have historically performed the worst during the month of September than any other month, the last two weeks of September is where most of the damage is usually done. It sure feels like it. Past performance does not predict future results.
While Yogi Berra is also famous for the quip, “It ain’t over, ‘til it’s over.”, we expect September to hold true to form and deliver a negative return for investors. We are just waiting for the “fat lady” to sing so we can move on to October. It is in October that we expect to see a noticeable shift in the direction of stocks and the start of an end-of-year rally.
Before we get to the year-end rally that we have been calling for since January, it is worth sharing our thoughts on what we have been “observing” while we “watch.” We have been doing a bit more watching than trading this year as we do not want to get caught zigging when we should have been zagging in such a volatile market.
I remember as a child being taught to sit still in a boat that is rocking, otherwise you will make things worse for yourself. My experience as a professional money manager has taught me something similar when it comes to choppy waters in the stock market.
The choppy waters for stocks have been brought about by any one of several forces: War in Ukraine, Fed rate hikes, inflation, supply chain issues, dollar strength, earnings misses, etc… It is the Federal Reserve, however, that is most influential. It is the Federal Reserve’s actions that drives how stocks react to all the other forces. It is why the axiom, “Don’t fight the Fed” is always worth remembering when investing in stocks.
As always, here at KIG, we set aside any personal opinions when it comes to politics or economics. Our charge is to navigate the waters of the Market regardless of the policies coming out of Washington or decisions out of the Federal Reserve. You can count on KIG to focus on investment decisions that deliver positive results rather than opine on the merits or drawbacks of decisions out of Washington.
Regardless of the business news channel you watch, the discussion on stocks is complex, confusing, and scary. In my 30+-year career as a professional money manager, I have learned that when markets turn scary, the math I use and the decisions I make SHOULD get simpler.
Addition and subtraction are the only tools you really need when investing. If you need to use calculus to make your investment decision, the risk goes up…..exponentially. So, when it comes to the forces influencing the Market’s direction, we think a simple view is better. To wit, below is a list of forces we are focused on rather than the calculus others are applying to problem.
The key influences we remain focused on at KIG are the following:
- Negative influences on stocks
- The Federal Reserve wants inflation down. Period.
- Corporate earnings will be hit by a slowing economy and strong US Dollar.
- Consumers are adjusting their spending to inflation.
- The housing market is slowing in terms of price appreciation, transactions, and building.
- Investors get scared when stocks go down. This leads to panic selling.
- Positive influences on stocks
- Inflation is unlikely to be a problem once the Fed beats inflation down.
- Corporate earnings will grow as inflation comes down and spending picks up.
- Consumer balance sheets are as strong now as any other time heading into recession.
- Rents are increasing to levels that will push people toward home ownership.
- Once every investor who wants to sell stocks is done, the buyers will step in big time.
A keen observer will note that the positive influences above are effectively the tradeoff to the negative influences. This is not Pollyanna. The reality is that the negative influences above will not last forever. Inflation is not going to 20% and staying there. Corporate managers eventually figure out how to turn a profit in any kind of economy. Individuals know how to adjust to inflation. A growing population is always at work in the housing market. Finally, Investors seem to always fear that stocks are going to zero and forget that it has never happened. Past performance does not predict future results.
In our letter to clients at the end of the 2nd quarter, we suggested that stocks had bottomed for the time being and that we were putting cash to work in our managed accounts. The S&P 500 Index rallied 15.7% from the date of that letter through August 16th.
Since August 16, stocks have given back most of those gains. While it is always painful to retest a low point in stocks, it is a healthy process that helps shake out the weak holders of stocks. The recent low of June 17 may or may not end up being THE low of the year but we expect stocks to be higher by year end. A retest of June 17 levels is an important part of the process stocks go through to hammer out a floor. Like our call at the end of the 2nd quarter, we are again calling for a bottom in stocks to form soon.
The low for the S&P 500 in June was 3,636. As I write, the index is at 3,662. A bounce before we make a new low could happen. However, if the 3,636 level fails to hold, a move to 3,300 will likely follow. That level is 10% lower from here, but interestingly it is also where stocks were in February of 2020 before COVID entered all our lives. Effectively, a drop to 3,300 would mean all the gains made during the pandemic will have been given back.
Regardless of whether stocks bounce before the June low is breached or they reach 3,300, we expect stocks to rally significantly into the end of the year. We see the potential for a rally that could see stocks rise by 15% from current levels. Into next year, we are constructive on the view that stocks could reach record highs. There are obvious risks to new highs being reached in the next 12 months, but we feel our view is measured.
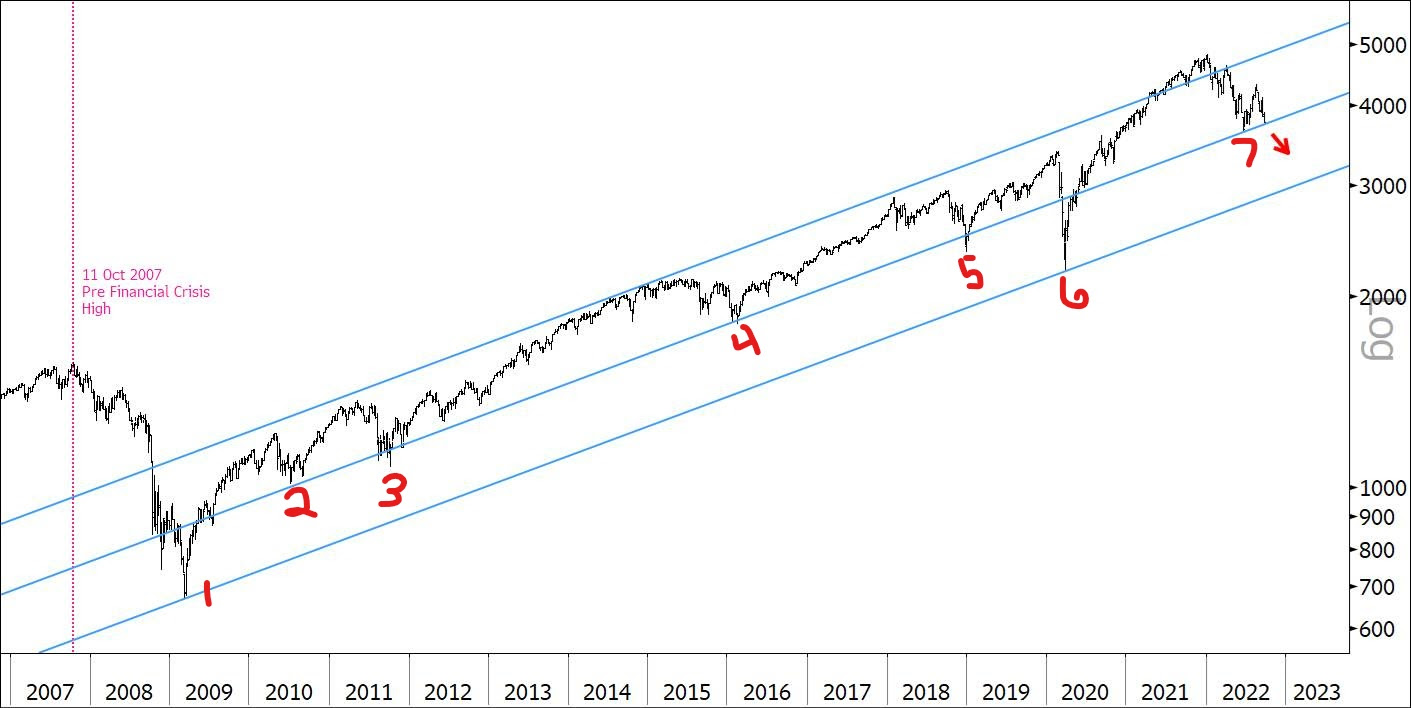
There are indicators we look to which suggest negative sentiment is peaking. A simple view of markets suggests that when negative sentiment spikes (usually after a significant stock market decline), prices stop going DOWN. Likewise, when positive sentiment spikes (usually after a significant stock market rally), prices stop going UP. The chart below is one we think illustrates how this works and why we think we are near a low and why stocks will move materially higher over the next year.
In the chart, you see the S&P 500 price since 2007. Starting at the Great Financial Crisis low in March of 2009 (#1), I have numbered each time the market has dropped to the middle trend line and the low end of the channel. Each of these points on the chart corresponds with a technical low in stock prices and a high in negative sentiment. In other words, it helps to show that when negative sentiment peaks, stocks tend to reverse and head higher. Past performance does not predict future results.
The table below the chart details the month of the technical low in price, the percentage of bearish sentiment (as measured by the American Association of Individual Investors) and the performance of the stock market over the following 12 months as measured by the Dow Jones Industrial Average. Past performance does not predict future results.
| Technical Low # | Date | Bearish Sentiment Level | 1-yr performance of DJIA |
| 1 | Mar-09 | 70% | 58% |
| 2 | Jul-10 | 57% | 27% |
| 3 | Aug-11 | 50% | 23% |
| 4 | Feb-16 | 49% | 31% |
| 5 | Dec-18 | 50% | 31% |
| 6 | Mar-20 | 52% | 73% |
| 7 | Jun-22 | 59% | |
| 8 | Sep-22 | 61% | |
As you can see, when bearish sentiment approaches or exceeds 50%, stocks have performed well over the next 12 months. Take note that bearish sentiment in June and right now is higher than it was at the beginning of COVID and only the depths of the Great Financial Crisis saw bearish sentiment higher. This is a good indicator that we are ready for a turn. Past performance does not predict future results.
Additionally, we offer the following data to support our view that even a recession is unlikely to derail a rally in stocks over the next 36 months. It is important to remind readers that our research suggests stocks and economy move in 17-year cycles. Although every cycle has the same level of volatility, “Bear Cycles” tend to see volatility push stocks lower, while “Bull Cycles” tend to see volatility push stocks higher. Since 2016, we have been in a “Bull Cycle” and think this trend for stocks in a “Bull Cycle” (green) recession will continue.
| Date Recession Began | Stock Performance 3yrs Later | Bull or Bear Cycle |
| Dec-70 | -4% | Bear |
| Nov-73 | -1% | Bear |
| Jan-80 | 31% | Bull |
| Jul-81 | 42% | Bull |
| Jul-90 | 25% | Bull |
| Mar-01 | -7% | Bear |
| Dec-07 | -19% | Bear |
| Feb-20 | ? | Bull |
As you can see in the table, stocks have done well over the next 3 years after the beginning of a recession when the economy is in a “Bull Cycle” like it is now. Past performance does not predict future results.
So, while the bear market is in full swing, we see light at the end of the tunnel for stocks. The risk of a recession is high, and we are likely already in a recession in certain parts of the economy. Nonetheless, we like stocks over the next several years.
Even though we are long-term investors, it is important to keep our finger on the pulse of short-term moves in stocks. Our clients expect it, and we use such short-term observations to help us sharpen our long-term decisions. So, whether our short-term analysis is correct, it helps in our long-term thesis.
All of us here at KIG are focused on delivering the highest level of client service as we work to deliver investment performance. We are thankful to all our clients and look forward to serving you for years to come.
Sincerely,
Kessler Investment Group, LLC
All information in this presentation is believed to be from reliable sources; however, we make no representation as to its completeness or accuracy. All economic performance data is historical and not indicative of future results. The market indices discussed are unmanaged. Investors cannot invest in unmanaged indices. Certain statements contained within are forward looking statements including, but not limited to, statements that are predictions of or indicate future events, trends, plans or objectives. Undue reliance should not be placed on such statements because, by their nature, they are subject to known and unknown risks and uncertainties. Please consult your adviser for further information.
Opinions shared in this presentation are not intended to provide specific advice and should not be construed as recommendations for any individual. Please remember that investment decisions should be based on an individual’s goals, time horizon, and tolerance for risk.