
“Dow plunges XXX points in worst day of XXXX!” -CNBC.com
I purposely left out the numbers because they ultimately do not matter. During my 28-year career, I have seen this headline XXX,XXX times. I expect to see it another XXX,XXX times before I retire.
OK. So, today saw the biggest drop in stock prices this year. What does this mean? Well, while this sounds like a dramatic statement, it should not be taken as anything more than a headline-grabber. It is no more “dramatic” than when it has been spoken countless times in the past. At the risk of sounding like a fortuneteller, please expect to hear the same phrase uttered by news outlets in the weeks/months/years to come.
Despite my long career in this industry, it seems the only thing I can truly predict is the way in which the press will report on it. That is not to say the press is wrong or guilty of proffering “fake news”. It is simply acknowledging that they are in the business (seeking profits) of attracting readers/listeners/viewers. This is a noble endeavor, but one must always understand what drives this endeavor. In the case of the press, their motivation is NOT to deliver reasoned and personal advice to their customers. No! it is to sell advertising while delivering information in a truthful and understandable way. Again, a noble endeavor but one which can lead to panic among those customers who forget that the press is not speaking directly to their personal and financial situation.
This statement is true when the market is nearing all-time highs. It is true when markets are hitting all-time lows. It is true when there are spikes up or down. Yet, never has it been the case that following the headlines has led to achieving life-altering wealth. Today is no exception to the rule.
When days such as today occur (and will occur in the future!), it is important to put them into perspective. It is what the pro’s, like Kessler Investment Group, do. So, here is our take on what is going on in markets and the economy right now.
Let us look at where stocks prices and interest rates stood twelve months ago. On August 6, 2018, the S&P 500 Index was at 2,840. Today, the Index closed at 2,844. In August of 2018, the Fed Funds Interest Rate was at 2.00%. Today, the rate is 2.25%. The Federal Reserve had raised interest rates 7 times over the previous 2 years heading into August of last year. Today, they have lowered rates once and seem poised to lower again.
There has been so little movement in stocks and interest rates over the last year, even Rip Van Winkle would wonder what all the fuss is about! Well, unlike Washington Irving’s loveable character, the rest of us have learned that we are in a trade war with China, corporate profits have peaked, housing has slowed, the Federal Reserve is raising interest rates, Russia is manipulating our elections, etc. Right?
Despite these news events, stocks remain essentially where they stood a year ago. Not significantly lower as some might expect. In our view, this is not an insignificant fact. When stock prices show resilience in the face of negative headlines and economic forces that typically force stocks lower, we pay attention. It can be a sign that stocks do not “want” to go lower. It can even suggest stocks are poised to go higher.
Before we get ahead of ourselves, let us be clear. We do expect stocks, over the next few weeks, to bounce around with a downward bias. We expect to see headlines reporting that stocks have declined further. We see little evidence that this decline will turn into anything close to a crash or even a text-book correction of 20% like we saw at the end of last year.
Here are few charts to support our view that, while stocks will decline in the very near term, the outlook beyond the next few weeks is solid. Keep in mind that past performance does not predict future results.
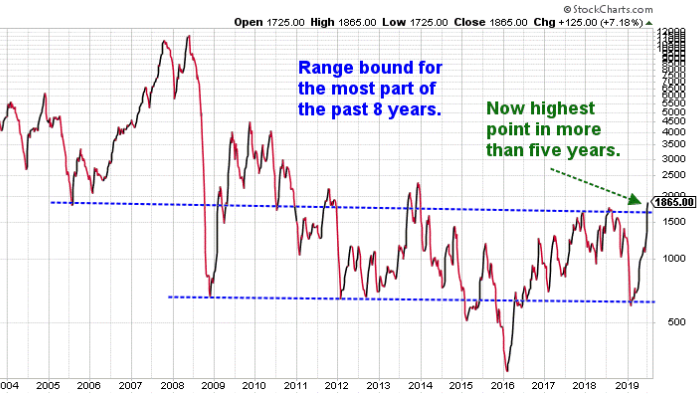
In the first chart below we see the Baltic Dry Index. This index measures shipping activity among huge sea-going tankers. While it has not recovered to pre-Financial Crisis levels, it is trending higher and at a level not seen in over 5 years.
In the second chart, we see how stocks have reacted to the first rate cut after the previous hike. The dotted line marks the point at which the rate cut occurred. The blue line shows how stock prices reacted if the rate cut occurred during a recession. The red line shows stock prices when there is no recession, as is currently the case. So, since 1921, the average gain for stocks 12 months following a rate cut, when not in a recession, is +24%.

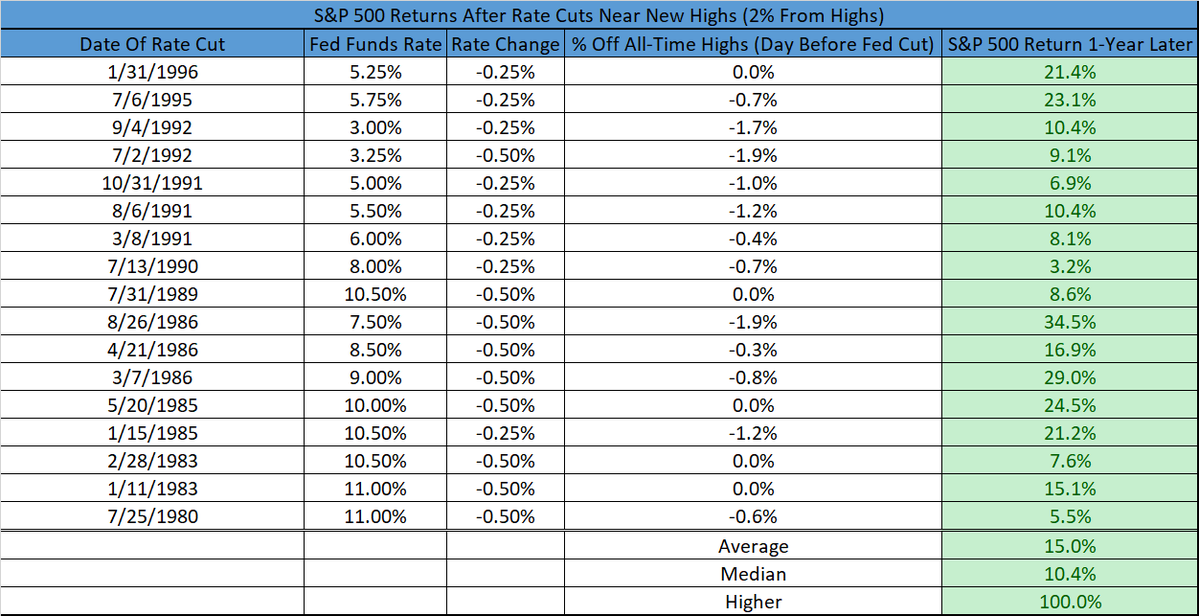
In the final chart, we see what happens to stocks when a rate cut occurs within 2% of an all-time high in stock prices (like now.) This scenario has occurred 17 times since 1980. In every case, stocks were higher 1-year later with an average gain of 15%.
All of us here at KIG are passionate about delivering results to our clients. It is a gift to have passion for what you do to make a living. We are grateful to our clients who have entrusted their hard earned portfolios to our care. We thank you for your continued trust.
Sincerely,
Craig Kessler, President and Chief Investment Officer
Kessler Investment Group, LLC