
As August arrived, we told clients to expect volatility to increase but that there was little reason to “run for the hills” and sell everything. Our expectation was that there would be a slight downward bias in stock prices along with the volatility but no dramatic sell off. As a result of this volatility, clues about the next leg higher in stock prices have been revealed. So, we have used this slight decline and increased volatility to purchase stocks that we believe look attractive for the next leg higher. We have also purchased a small position in gold for one of our managed accounts for clients.
Before I delve into our forecast for stocks/bonds, let’s look at what happened in August. To start, we came into August at an all-time high for stocks. The S&P500 peaked around 3,027. Then the Federal Reserve decided to lower interest rates as was expected. In response, stocks sold off on Friday, August 2 bringing the S&P500 down to 2,931.
This downdraft led many investors, and some “professionals”, to fear the bottom was about to fall out of the market. Sure enough, stocks fell further on Monday, August 5 (S&P500: 2,822) before rebounding higher than the 2,931 level from the previous Friday.
Over the remaining days of August, stocks bounced around but never fell lower than the SP500 low of 2,822 or rise above the 2,930 level of Friday, August 2. In other words, stocks bounced around but never really broke down or broke out. Yet, the news flow remained muddled in negativity and fear. So, the lows for the year are in, we believe. We expect stocks to hit new all-time highs soon.
There will come a time to react to the fear and negativity surrounding the market, but now is not that time. We continue to expect stocks to rise over the coming months and investors who are too cautious will miss out on what we believe will be solid gains. Now that we are into September, let us share a few tidbits that augur for higher stock prices.
While, it is well-known that September is the “worst” month for stocks on the calendar. There are always exceptions. We think this September will be one of those exceptions. Data suggests it might matter how well the market is doing ahead of any particular September when it comes to whether it lives up to the reputation of “worst month for stocks.”.
Ryan Detrick, Senior Market Strategist for LPL Financial offers the following chart that illustrates what we mean. The chart shows how stocks have performed when the S&P500 is trading below its 200-day moving average.
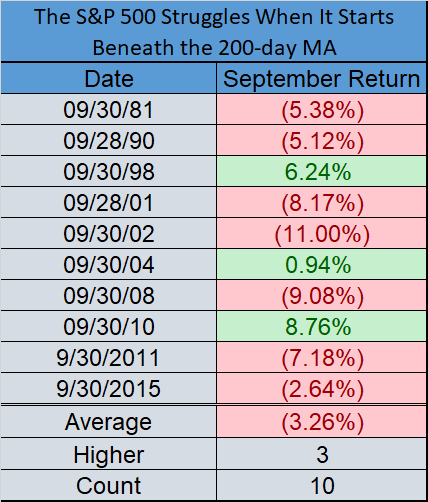
As you can see, stocks have typically done poorly when the averages are already weak heading into September. Only 3 out of the last 10 times this has happened have seen positive performance for the month.
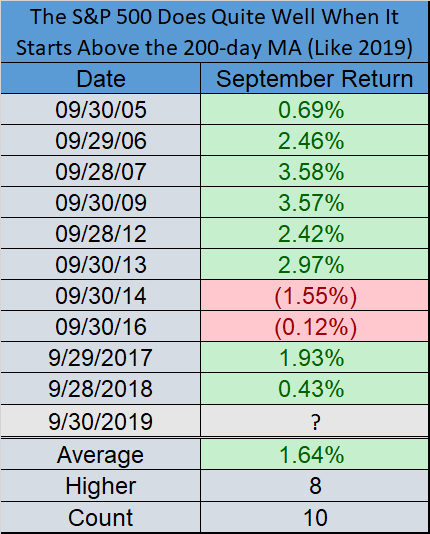
However, coming into September this year, stocks are trading above their 200-day moving average. The chart below gives us a look at the last 10 times this has happened. A different picture develops from the one above. In 8 out of 10 times, stocks ended the month of September higher than they did at the beginning.
There exists a competition between stocks and bonds when it comes to yield. When investors find interest rates too low to be attractive, they turn to stocks. Many stocks pay a dividend which can take the place of interest payments for investors willing to accept the risk of owning stocks. Currently, the average yield of 40% of the stocks in the S&P500 is higher than the yield on the 30-year Treasury Bond. This means you can earn more “yield” on 200 different stocks than you can on a bond with a 30-year maturity. Many investors see this as an opportunity to collect more income than with bonds while also having the chance for those dividends to increase along with the stock price.
Continuing with the positive tone, here are some statistics related to the broad market’s performance this year. When the S&P500 has been up more than 10% through the first 3 months of the year, stocks were higher at the end of the year. When stocks have been higher in the first 2 months of the year, they remained higher 25 out of 27 times. When stocks have been higher in the first 3 months of the year, stocks remained higher 18 out of 19 times. In all 34 times the SP500 did not close below previous December’s low, stocks were higher for the whole year.
Another statistic looks at how “bullish” or “bearish” amateur investors feel. Behavioral analysis suggests that amateurs tend to be “bullish” just before stocks decline and “bearish” just before stocks rise. When looking at the American Association of Individual Investors (AAII) survey, if it drops to less than 25% bullish (read: bearish), stocks have closed higher 93% of the time over the next 12 months with an average gain of 17%.
The trade war has played a role in bringing about the recent volatility. However, we do not see the “war” as having a materially negative impact on the economy. While many investors and commentators worry that the “trade war” will destroy the economy here in the U.S., here is a data point to keep in mind. According to Brian Wesbury, Chief Economist at First Trust Portfolios, through June, total trade with China (exports+imports) was just 13.2% of total U.S. trade with the world. The trade war is having a short-term negative effect on the economy but not 100% of it.
The recent inversion of the yield curve is worth noting. Every time the yield on the 2yr Treasury has risen above the 10-yr Treasury, a recession has followed approximately 18 months later. While a brief period of inversion is not enough to bring about a recession, this inversion has lasted sufficiently long enough to qualify as an indicator that a recession will occur in the next 24 months.
A recession in the future should not come as a surprise. This is already the longest expansion on record with no recession. It is important to understand that stocks historically have performed very well once the yield curve has inverted. We expect this to be the case over the next two years.
A final observation we want to share with clients pertains to our 17-year market cycle thesis. We believe we are in the early years of the current cycle which began in 2016 and will continue through 2032. We believe stocks will deliver above average gains during this period as they did during the last 17-year cycle like this one. That cycle ran from 1982-1999.
When making historical comparisons, we believe it is important to find the similarities and not be distracted by the differences. When comparing the ’82-’99 “growth cycle” to now we see many striking similarities.
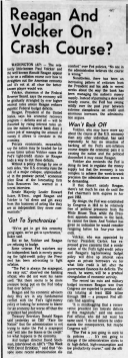
One similarity is found in the tug-of-war between the Federal Reserve and the White House. In 1982 a tug-of-war between President Reagan and Federal Reserve Chairman Paul Volcker made headlines.
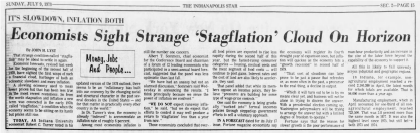
At the time, “Stagflation” was the fear. Stagflation is when stagnant growth occurs alongside rising inflation. The textbooks told us back then this was not possible. Yet, it happened. The Fed decided to tackle inflation by raising interest rates rather than lower them to stimulate the economy. This opened the door for President Reagan.
When Reagan entered office, he went against his own party and pushed for tax cuts (Funny to think that Republicans opposed tax cuts, but they did.) and pushed growth initiatives, like the 600-ship Navy and de-regulation, etc.
The combination of pushing on the economic “brakes” (raising interest rates), while stepping on the economic “gas” (tax cuts and de-regulation), broke the back of “stagflation” and an extended period of economic growth followed. We saw oil prices come down, interest rates come down, stocks go up and the dollar decline. This continued until the cycle ended at the beginning of 2000.
I will coin a new term for this cycle; “Greflation”. It is the name for a period (like now) when we see economic growth and deflation occur at the same time. As was the case in the late ‘70’s, the textbooks tell us this is not possible. Since “Greflation” is the mirror image of “Stagflation”, we expect monetary and fiscal policy to flip flop, too. This means we expect the Federal Reserve to embark on a fresh effort to stimulate the economy (lower rates) while President Trump presses China (and the rest of the world) with tariffs. We also expect interest rates to clime (rather than fall), oil prices to rise (rather than fall), dollar strength (rather than weakness), etc. What will importantly be the same is higher stock prices.
These similarities are what we see when looking at the beginning of the last 17-year growth cycle (1982-1999) and the one we believe started in 2016 and will continue through 2032. While the difference between then and now is obvious (Rates were “high” back then and “low” today, Reagan tore down the Berlin Wall and Trump is raising a border wall, etc., etc.) What is important is that rates were at an extreme then and are at an extreme now. Federal Reserve policy wrestled with White House policy then and it does so today. An economic phenomenon (“stagflation”) developed then, and one (“greflation”) is developing today. Reagan was an outsider and an entertainer, Trump is, too”. The similarities are harder to see at times but more valuable to understand.
Below are a few headlines from the late ‘70’s and early ‘80’s to illustrate our view that what we see happening today between the Fed and the President is not too “different.”

So, we believe the volatility of August will give way to a stronger stock market in September and through the end of the year. We are in the early years of a decade-long period of growth similar to what we saw in the ’80’s and ’90’s. Interest rates will decline in the near term as the Fed tries to fend off deflation and global recession, but this will give way to higher rates over the next several years. The dollar will strengthen once rates begin to rise and this will provide U.S. consumers with the power to buy goods at cheaper prices. The tariff war will carry on like a kind of “cold war” of sorts. Ultimately, though, economic growth is ahead along with higher stock prices.
As always, past performance does not predict future results.
Sincerely,
Kessler Investment Group, LLC